
"35 min delivery" is not a number. It is four independent ML models pretending to be one number.
You have seen it happen. Swiggy says 35 minutes. You wait. At some point, mid-order, it quietly jumps to 48 minutes. No explanation. Just a bigger number.
Most people assume it is a bug, or that Swiggy is just being conservative. The reality is more interesting: that bump is the result of real-time signals diverging from four separate prediction models that were stitched together when you placed your order.
This post breaks down exactly how it works, and how Swiggy and Zomato do it differently.
The Core Insight: One Number, Four Models
When you place a food order, the platform needs to answer one question:
"When will this food reach the customer's door?"
The naive approach is to train a single end-to-end model: take all inputs, predict one output. But Swiggy and Zomato do not do this, and for good reason.
A food delivery involves three fundamentally different systems:
- Marketplace dynamics: is there an exec available to take the order?
- Road traffic: how fast can the exec move through the city?
- Restaurant operations: how fast is this specific kitchen working right now?
These systems have different data sources, different volatility patterns, and different failure modes. A single model cannot capture all three well. So they decompose the problem.
Every delivery ETA is broken into four independent legs, each predicted by a separate model.
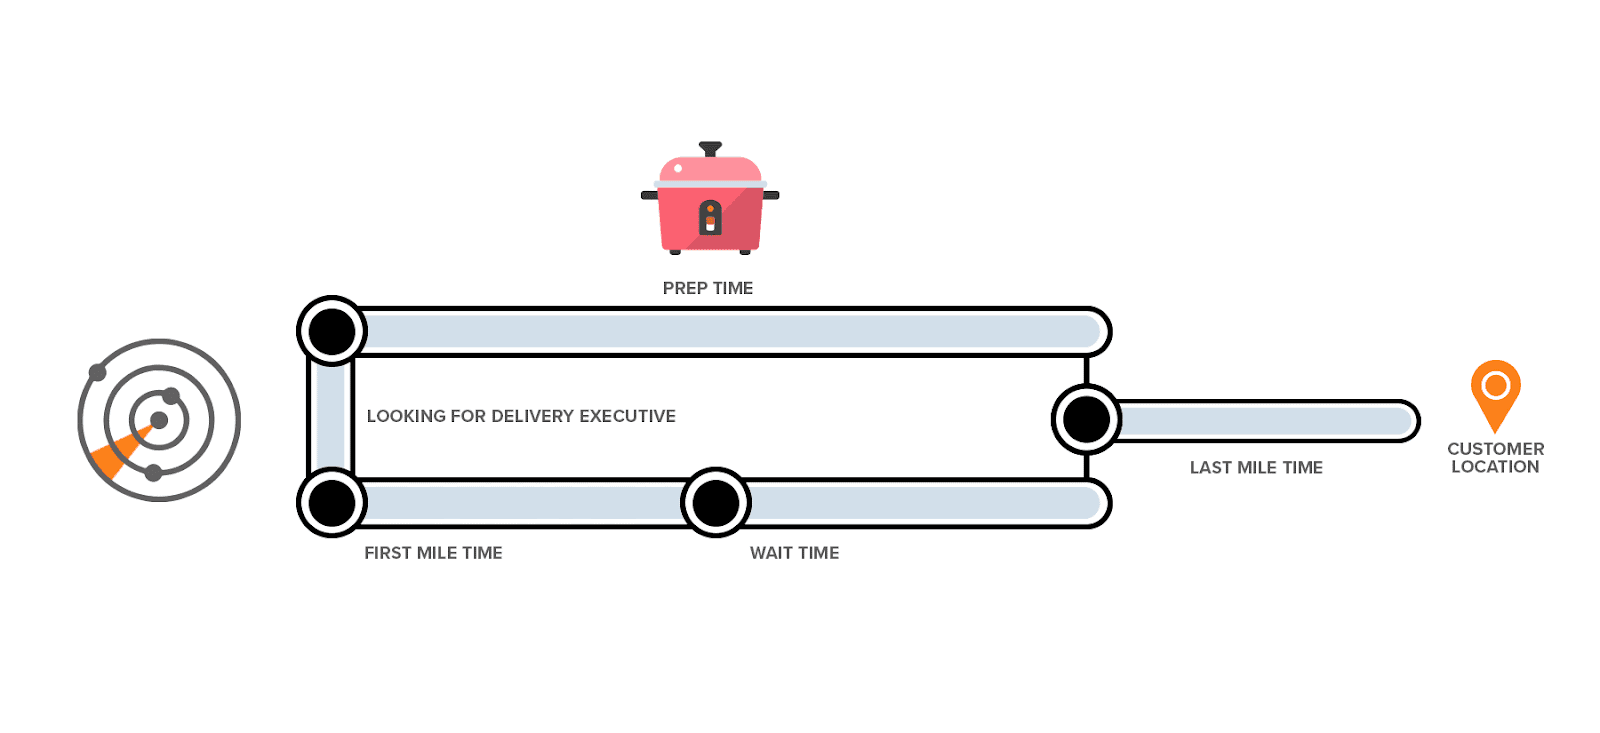
The Four Models — What Each One Actually Does
Each leg answers a different question, which is why they are modeled separately instead of forcing everything into one black-box number.
Model 1: Order-to-Assignment
Question: how long until a delivery exec accepts this order?
This is a supply-demand problem. Inputs include available execs inside a radius, active orders competing for those execs, time of day, and day of week.
The model computes a supply ratio: available execs divided by active orders in zone. Low ratio means long wait. Peak hours like lunch and dinner add another penalty on top.
This leg is often invisible to users. It is the gap between "Order Placed" and "Order Accepted by Partner."
Model 2: First Mile
Question: how long for the exec to reach the restaurant from their current location?
Inputs include the current GPS coordinates of the assigned exec, restaurant coordinates, and a real-time traffic factor rather than a static map estimate.
That traffic factor is derived from live ping data from all delivery execs currently moving through the city, effectively a crowdsourced traffic layer built from the platform's own fleet.
Simplified formula:
first_mile_time = (exec_to_restaurant_km / avg_speed) x 60 x traffic_factor
Model 3: Restaurant Wait Time
Question: how long will the restaurant take to prepare the food?
This is the hardest leg to predict because restaurant throughput is highly variable. Inputs include historical average prep time, current queue depth, and a restaurant stress signal, a live score derived from how many recent orders came out late.
The stress signal is what makes this model interesting. If a restaurant has had five delayed orders in the last twenty minutes, the model increases its prep estimate even if the historical average is low. It is essentially measuring how overwhelmed the kitchen is right now.
Zomato goes deeper here. Their prep-time stack is described as a standalone Bidirectional LSTM using inputs like dish type, quantity, restaurant behavior patterns, time of day, and recent footfall. A separate neural network whose only job is to predict how long your biryani takes.
Model 4: Last Mile
Question: how long for the exec to travel from the restaurant to the customer?
This is similar to First Mile, but with one addition: junction penalties.
Indian cities have notorious bottleneck junctions, intersections where traffic consistently backs up regardless of time of day. Bangalore's Silk Board is a classic example: a named variable that adds a fixed time penalty whenever the route passes through it.
This is not a generic traffic estimate. It is a learned, location-specific penalty baked into the model.
How the Final ETA Is Computed
The stitcher adds all four legs:
Final ETA = ceil(Assignment + FirstMile + WaitTime + LastMile)
That ceil() rounds up to the nearest minute, which is why you never see 34.7 min.
This stitched number is what gets shown on your screen.
Why the ETA Bumps Mid-Order
At order placement, the four models run on the best available signals at that moment. But the signals keep updating.
- Traffic worsens because a jam appears on the route
- Restaurant stress spikes because the kitchen starts falling behind
- The exec gets stuck, delayed, or takes a detour
When real-time signals diverge significantly from the initial prediction, the platform re-runs the affected legs. If the new total exceeds the original by more than a threshold, typically around five minutes, it triggers a bump: the ETA update you see on screen.
Critically, not all four legs are re-predicted. Assignment and First Mile are usually locked by the time a bump occurs. Only WaitTime and LastMile remain live until pickup and dispatch are clearer.
Example:
T+0 Initial prediction -> 35 min
stress_signal = 0.7
traffic_factor = 1.8x
T+8 Real-time update
stress_signal -> 0.95
traffic_factor -> 2.4x
WaitTime re-predicts: +5 min
LastMile re-predicts: +3 min
New total -> 43 min
Swiggy's Bump Quality Metric
Swiggy does not just track whether ETAs are accurate. They also track bump quality.
The important distinction is that not all bumps are bad. A bump caused by a restaurant running behind, or an exec being batched into another flow, is justified because it communicated a real delay.
An unjustified bump is worse. That is when the ETA jumps but the order still arrives at or before the original promise. Those phantom bumps damage user trust and increase cancellation risk.
So ETA quality is not just "was the final number close?" It is also "was the correction itself warranted?"
Swiggy vs. Zomato — Same Number, Different Architecture
Both platforms show one ETA and both decompose it internally, but the architecture differs in emphasis.
- Swiggy: four explicit leg models stitched together
- Zomato: a more layered stack with prep-time and delivery ETA modeled separately plus dynamic buffering
- Prep time: Swiggy treats it as one ETA leg, while Zomato invests more deeply in a standalone Bidirectional LSTM
- Last mile: Swiggy uses its own model stack, while Zomato leans heavily on delivery-partner GPS and tree-based delivery ETA logic
- Maps: Zomato enriches open maps using its own delivery-partner pings to reconstruct roads and find shortcuts missing in dense Indian areas
- Explainability: Swiggy emphasizes debugging and bump quality, while Zomato emphasizes per-window ETA compliance and route enrichment
Zomato's map enrichment is especially clever. OpenStreetMap is incomplete in many dense Indian zones, so delivery-partner GPS traces can be used to reconstruct missing roads and last-mile shortcuts. Same user-facing number, very different backend investment.
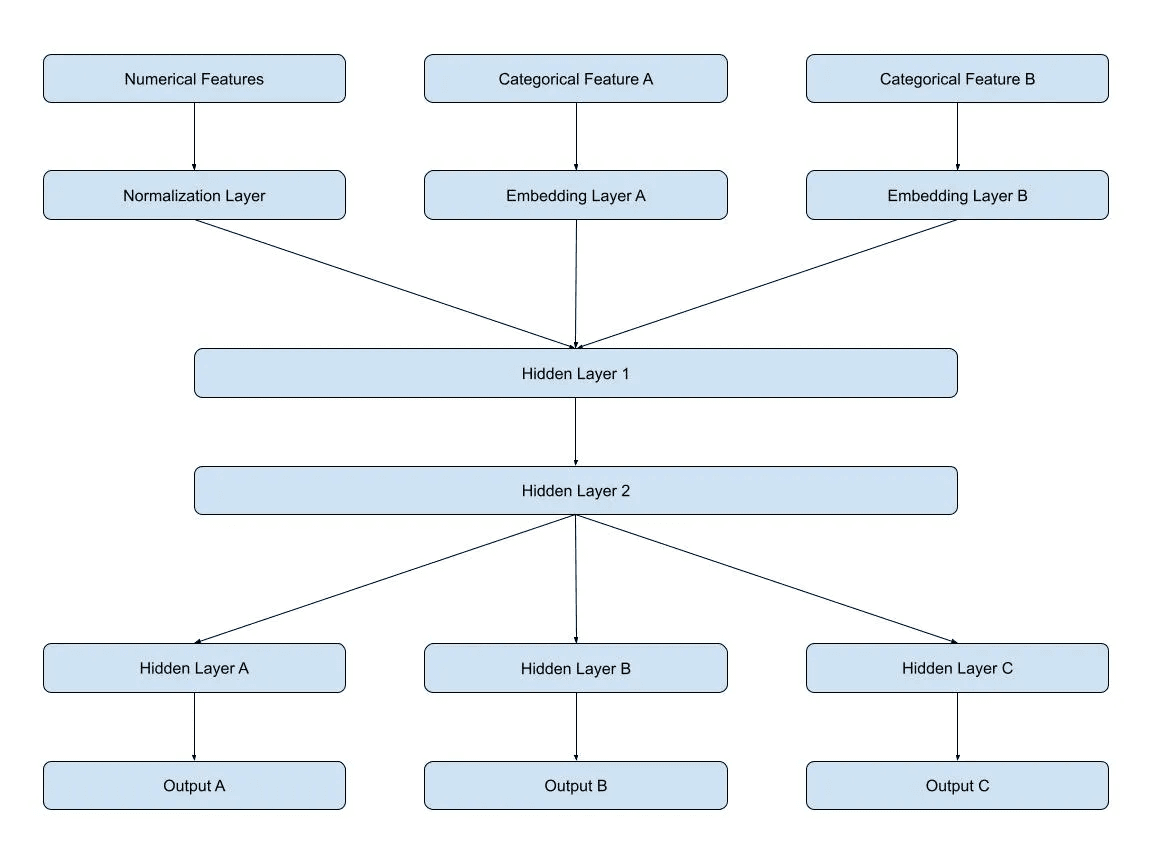
The Go Prototype
To make this concrete, I built a small Go prototype that simulates all four legs and the mid-order bump detection.
No ML libraries. Each leg is a weighted formula that mimics what the real models output. The point is to understand the architecture: how four independent functions combine into one number, and how a divergence event triggers a partial re-prediction.
What the prototype does:
- Takes an
OrderContextas input with fields like exec distance, traffic factor, queue depth, and stress signal - Runs all four leg functions independently
- Stitches them into a final ETA breakdown
- Accepts updated real-time signals in a second call
- Re-runs only
WaitTimeandLastMile - Emits a bump event if the delta exceeds threshold, including trigger leg and reason
Sample output:
=== ETA Engine: Order #8821 === [Model 1] Assignment -> 5.0 min (supply_ratio: 0.37, peak: true) [Model 2] First Mile -> 7.6 min (dist: 1.4km, traffic: 1.8x) [Model 3] Restaurant Wait -> 23.6 min (queue: 6, stress: 0.70) [Model 4] Last Mile -> 20.3 min (dist: 2.1km, junction_penalty: +8min) -------------------------------------- Quoted ETA -> 57 min T+8: Real-time divergence detected Restaurant stress: 0.70 -> 0.95 Traffic factor: 1.80 -> 2.40 [Model 3] Wait (revised) -> 27.6 min (+4.0) [Model 4] Last Mile (rev) -> 25.1 min (+4.8) -------------------------------------- Revised ETA -> 66 min BUMP (+9 min) Trigger: WaitTime + LastMile divergence Reason: restaurant_stress_spike + traffic_divergence
Key Takeaways
- "35 min delivery" is four numbers. Each leg is separate because the underlying systems are separate.
- The bump is a feature, not a bug. It is the system correcting itself when live signals diverge from the initial estimate.
- Restaurant stress is the hardest signal. Kitchen throughput is volatile and often the biggest reason ETAs jump.
- Justified bumps and unjustified bumps are not the same. Accuracy is not just MAE. It is also whether the bump deserved to happen.
- Swiggy and Zomato share the same UX but not the same ML stack. The common number hides very different architecture choices underneath.
The next time your ETA jumps, you will know exactly which model changed its mind, and why.